


The visibility into the performance of an application and the network is provided by the vAnalytics platform. vAnalytics platform is a SaaS service hosted by Cisco SD-WAN solution. The entire overlay network is graphically represented by the vAnalytics platform and lets you know the characteristics of a single carrier, tunnel, or application at a certain point in time.
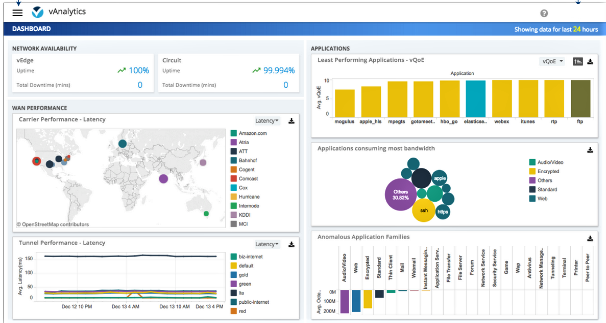
The vAnalytics dashboard provides an interactive overview of the network. The last 24 hours aggregated information is displayed by default. But, you have the option to select different time periods for different data sets. Data on application performance, WAN site usage, and carrier usage are displayed by the dashboard.
The Viptela Quality of Experience (vQoE) is used by vAnalytics platform to calculate application performance, which is customized for individual applications. This value range is zero to ten (0-10), with zero being the worst one and ten being the best. The vQoE value is calculated by the vAnalytics platform, based on latency, loss, and jitter, with customization for each application.
The vAnalytics data could be used for future planning. The data stored by this platform over a period of time displays historical trend information.
vAnalytics platform offers:
Application visibility:
Best and worst performing applications: The best performing applications and worst one is displayed.
Applications consuming most bandwidth: Applications consuming the most bandwidth are displayed.
Network visibility:
Network availability and circuit availability: Network and circuit availability are displayed.
Tunnel performance: Key performance indicators such as loss, latency, and jitter over different tunnels are displayed.
Carrier usage views: Providers and their network characteristics are displayed.